An annual report is really just another way and opportunity to tell your story. Available to stakeholders, investors and customers, it’s a comprehensive report on your company or organisation’s activities and financial performance during the last fiscal or financial year.
But an annual report is not just about figures, charts and graphs. It tells the story of an organisation’s past, present and future. It conveys your company’s aspirations and goals, its culture and its brand values. It’s a powerful platform because it has the power to educate, inspire and influence readers.
It’s fair to say that traditionally, annual reports aren’t always the most fun projects for a designer to work on. And with their text heavy content, some can be as dull as dishwater to read. But with a bit of creative thinking, a good designer can turn a potentially boring annual report into something that’s both visually appealing and a worthwhile read. In other words, something far from dull. Which is great news for engagement and retention.

Think of your annual report as a great opportunity to produce something engaging for brand building. So try to think outside the box a little. Use the occasion to share what’s happened in the past 12 months: what you’ve learnt, your successes and the challenges you’ve faced and overcome.
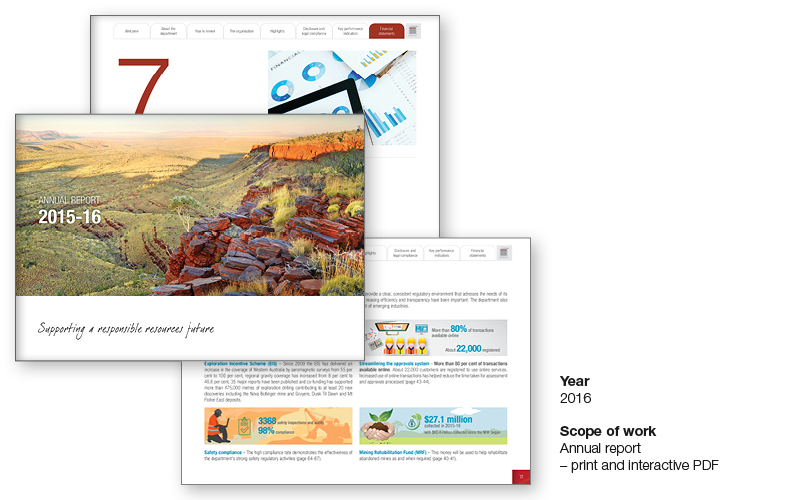
One of our most recent projects was to design an eye-catching annual report for an organisation in Perth, made available in printed format and also as an interactive PDF. They wanted to take a different approach to past projects which, by their own admission, were bland and uninspiring. And so we delivered an annual report that featured a fresh, bold and modern design.

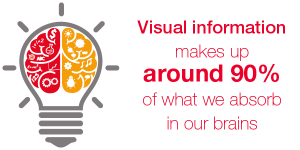
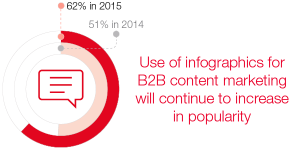
We also introduced the use of infographics to draw attention to key points and to make the content more visually appealing and the information easier to digest. Visual information makes up around 90% of what we absorb in our brains. For that reason, when presenting information with a lot of numbers, infographics are an invaluable tool to draw the reader in. In fact, the use of infographics for B2B content marketing increased from 51% in 2014 to 62% in 2015, and continues to increase in popularity.
Here at TAD Graphics we have the creative skill set and experience to help you present your organisation’s story in a format that will speak to your target audience. We work with our clients to develop the report, providing our knowledge and creative design to produce a persuasive piece of literature which will communicate your activities and values effectively.
We know what it takes to make your annual report design work hard for your company or organisation. Our skill set includes creative and graphic design, web design and digital media and copywriting. We can also provide high quality images to tell your story.
Get in touch to see how we can help transform your ideas into a visually stunning finished product you’ll be proud to put your name to. Email tadgraphics@t-adstudio.com or call + 61 402 636 014.
