• Skip to primary navigation
  • Skip to main content
TAD Graphics logo

t ad studio | tad graphics

A vibrant, multi-disciplinary advertising, communications, creative and digital agency

  • About us
  • What we do
    • Creative and graphic design
    • Copywriting
    • Marketing and advertising
    • Promotional photography
    • Web design and digital media
  • Portfolio
  • Blog
  • Contact us
  • Shop prints

infographics

Ten tips for designing infographics

1 March 2018 by tadgraphics

Ten tips for designing infographics

In our previous infographics blog, we discussed the advantages and disadvantages of using infographics in content marketing. In part two we provide our ten top tips to help you design successful infographics.

1. Know your target audience

Idea is only half the battle when it comes to creating a killer infographic. If you don’t know your target audience, your infographic is likely to be more ordinary than extraordinary. And that’s the last thing you want. The infographics with the most footing, most consideration, and most vitality are ones that meet your intended interest group right where they need it most.

Don’t make the mistake of creating an infographic that is generically attractive, rather than uniquely relevant to your target audience. The infographic has an intended appeal to your audience, so keep it precise, relevant, and targeted.

2. Keep it simple

One of the key advantages of infographics is that they can distill advanced ideas into a simple visual form. But at the same time, the inherent power of infographics can also be their demise. An infographic can become needlessly complicated, creating a mind-numbing cognitive overload rather than an “Oh, I get it” experience. Like everything else in life, infographics are better when they are simple. This infographic would work better as four or five infographics. Simplicity wins every time.

3. Keep it focused

Do not make your infographic a blend of statistical data points. Instead, make it streamlined and concentrated on separate topics. Infographics are not endeavors to randomly amass every single bit of information you can gather. Rather, an infographic should be used to drive a single, centered point.

4. Show things visually

Infographics should be short on the “realistic” and long on the “data.” The best infographics are ones that have a precise sense of balance of visual information with written information. This infographic uses a few icons and an image, but not a whole lot of other visual elements. To qualify for the graphic in infographic, it needs more visual elements.

5. Promote it

Infographics do not automatically go viral. You have to put in the time and effort to promote it. Even the most brilliant infographics don’t become popular over night. So yes, your infographic will require a lot of promotion. This can be done in the same way that you’d develop any other valuable piece of content.

6. Make it easy to view

Now and then, an infographic becomes mixed up in its resizing. The designer makes it colossal; at that point, the developer needs to cut it down. All the while, the clarity gets lost. Many infographics have an assortment of text dimensions. Ensure that the smallest text size on your infographic can be seen without much trouble. An infographic should be easy to read and view; 600 pixels wide is a good width to aim for.

7. Make it a convenient length and size

Infographics are supposed to be big. We get that. But go too big, and you’ll start losing people. A limit length of 8,000 pixels is recommended. Alongside a length, file size of an infographic must also be considered. Many users are on a moderate connection, so always try to keep your infographic to approximately 1.5 MB.

8.  Add white space

An infographic is an exercise in graphic design best practice. Which means it is important to add white space around each individual graphic, to give it some breathing space. Your reader will thank you.

9. Create a killer headline

Your infographic’s headline is hugely significant. This rule is the same as with any blog article. The infographic does not get any consideration if it does not have a good headline. So what makes a good headline? Good headlines will have these features:

  • they describe the infographic.
  • they capture the user’s attention.
  • they are short enough to understand at a glance; 70 characters is a good length.

10. Check your facts and figures

Infographics concentrate on displaying information. It’s a quick thought. Our brains can process details and rates way better when we see them, ensure that you’re precise by concentrating on these three often overlooked points.

  • Make sure the information is real.
  • Make sure that your sources are dependable.
  • Make sure that your graphical illustration of the data lines up with the number (if you have both).

Conclusion

The wide-spread use of infographics is a relatively recent phenomenon. But the use of infographics to convey information is extremely popular. Infographics can offer you an unprecedented amount of ways for your business to stay ahead of the competition.

In terms of content marketing for your business, it’s worth looking into infographics. Especially if you have a blog or social media channels, because an attractive infographic makes for highly shareable content. But infographics might not be the most cost-effective type of content for your business. So make sure you understand the pitfalls before shelling out hundreds of dollars with high expectations.

If you would like to know more about infographics and how they could benefit your business, please do not hesitate to get in touch.
Filed Under: Blog, Graphic design, Web design Tagged With: design, graphic, infographic, infographics, information, web

Introduction to infographics

30 October 2017 by tadgraphics

Infographics

Information graphics or infographics as they are more commonly known, are widely used in visual content marketing. More and more businesses are utilising infographics as an efficient way to communicate their composite message in a way that is both easy to comprehend and visually pleasing.

The internet has taken visual marketing to the next level, and infographics are becoming a significant part of that growth. In fact, it is estimated 84 per cent of communications will be visual by 2018, and 79 per cent of internet traffic will be video content by 2018.

So yes, infographics certainly have an important role to play in visual marketing. According to the Content Marketing Institute, the use of infographics has risen from 50 per cent in 2015 to 58 per cent in 2016. And their popularity shows no sign of slowing down.

What is an infographic?

Infographics include a combination of information and graphics featuring charts, diagrams, photos and stylised text. An effective way of creating a story in a more entertaining and eye-appealing manner, visual content marketing has been proven to be many times more effective than text.

This representation of information in a graphic format is designed to make the data easily understandable at a glance. People use infographics to communicate a message quickly, to simplify the presentation of large amounts of data, to see data patterns and relationships; and to monitor changes in variables over time.

According to Usability expert Jakob Nielsen, the regular user knows at most 20 to 28 per cent of words during an average visit. An average person also gets distracted in eight seconds, though a mere 2.8 seconds is enough to distract some people. If you want your message to be seen and understood, infographics are a highly useful tool.

Advantages of infographics

Provides essential facts and figures

People love reading facts, numbers, statistics and other such data. Infographics can help provide this information in a prearranged appealing way. Infographics are much more eye-catching than text. By using infographics to increase interest, it will give your site or blog a lot more drawing power.

Easier to comprehend

. Infographics are visually appealing. Used correctly, they are much easier to understand than text data. The human brain can process and commit to visual memory information better than text.

Social media

Infographics are also on the rise in social media. By combining the influence of infographics and social media, who knows how far your business could go. Social media is a fast-paced platform and when used appropriately will help your business to progress and be noticed. With infographics, all of the information is right there. There is no clicking to get here or there, nothing to sign up for or add time to your readers’ visit.

Simplify the subject matter

Reading lengthy text to understand the data is a very composite and unsightly task. Infographics can present the same issue in a more orderly and simplified way, thus making it incredibly easy for your readers to read and understand the given information.

Disadvantages of infographics

Time consuming

Excellent infographics are not easy to make and call for a decent time investment. Infographics must be thoroughly researched and outlined, cautiously and efficiently designed, and well promoted.

Not naturally SEO friendly

One of the biggest disadvantages of using infographics is that they are not seen as substantial content for search engines; they are not search engine friendly. SEO, particularly localised SEO, is very important for most small businesses to drive real organic customers. A workaround is to post the infographic details in text form, underneath the infographic, and adjust it for keywords.

Require a flexible budget

Many small businesses just do not have a flexible budget to test an infographic drive. The creation of infographics requires many hours or days, and outsourcing the design work to creative professionals can be costly. As a small business entrepreneur, you want to be sure every dollar you invest is going to have a positive return on investment (ROI).

Possible futility

Investing hundreds of dollars into an attractive infographic does not imply viral popularity. There is still a possibility that no one will take notice. This is because creating an infographic is only half the battle. The other half is promoting it. If you still have not considered these steps, your professionally designed infographic could very well fade away into the internet abyss. Also, factors such as timeliness and insignificance can weigh down your campaign.

If you’re looking for a web and graphic designer in Perth, and you would like an informal, obligation free chat about your infographic options, please feel free to get in touch with us.

Filed Under: Blog, Graphic design, Web design Tagged With: benefits, blog, design, graphic, infographic, infographics, trends, web, website

Annual report design

1 November 2016 by tadgraphics

Annual report design

An annual report is really just another way and opportunity to tell your story. Available to stakeholders, investors and customers, it’s a comprehensive report on your company or organisation’s activities and financial performance during the last fiscal or financial year.

But an annual report is not just about figures, charts and graphs. It tells the story of an organisation’s past, present and future. It conveys your company’s aspirations and goals, its culture and its brand values. It’s a powerful platform because it has the power to educate, inspire and influence readers.

It’s fair to say that traditionally, annual reports aren’t always the most fun projects for a designer to work on. And with their text heavy content, some can be as dull as dishwater to read. But with a bit of creative thinking, a good designer can turn a potentially boring annual report into something that’s both visually appealing and a worthwhile read. In other words, something far from dull. Which is great news for engagement and retention.

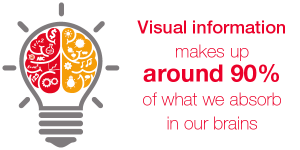
Visual information makes up around 90% of what we absorb in our brains

Think of your annual report as a great opportunity to produce something engaging for brand building. So try to think outside the box a little. Use the occasion to share what’s happened in the past 12 months: what you’ve learnt, your successes and the challenges you’ve faced and overcome.

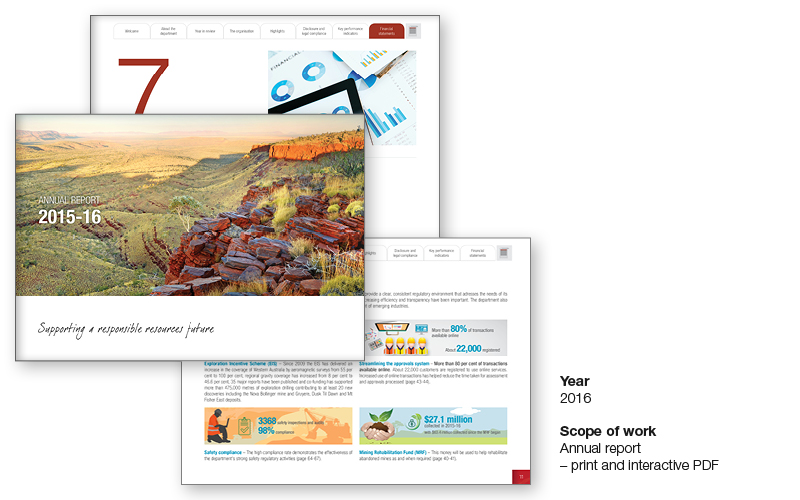
One of our most recent projects was to design an eye-catching annual report for an organisation in Perth, made available in printed format and also as an interactive PDF. They wanted to take a different approach to past projects which, by their own admission, were bland and uninspiring. And so we delivered an annual report that featured a fresh, bold and modern design.

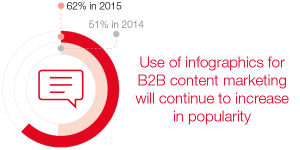
The use of infographics for B2B content marketing increased from 51% in 2014 to 62% in 2015, and continues to increase in popularity

We also introduced the use of infographics to draw attention to key points and to make the content more visually appealing and the information easier to digest. Visual information makes up around 90% of what we absorb in our brains. For that reason, when presenting information with a lot of numbers, infographics are an invaluable tool to draw the reader in. In fact, the use of infographics for B2B content marketing increased from 51% in 2014 to 62% in 2015, and continues to increase in popularity.

Here at TAD Graphics we have the creative skill set and experience to help you present your organisation’s story in a format that will speak to your target audience. We work with our clients to develop the report, providing our knowledge and creative design to produce a persuasive piece of literature which will communicate your activities and values effectively.

We know what it takes to make your annual report design work hard for your company or organisation. Our skill set includes creative and graphic design, web design and digital media and copywriting. We can also provide high quality images to tell your story.

Get in touch to see how we can help transform your ideas into a visually stunning finished product you’ll be proud to put your name to. Email tadgraphics@t-adstudio.com or call + 61 402 636 014.

Filed Under: Blog, Graphic design, Portfolio Tagged With: annual report design, graphic design, infographics, photography

© Copyright 2005-26. All rights reserved. t ad studio | tad graphics. Web and graphic design Perth. Admin