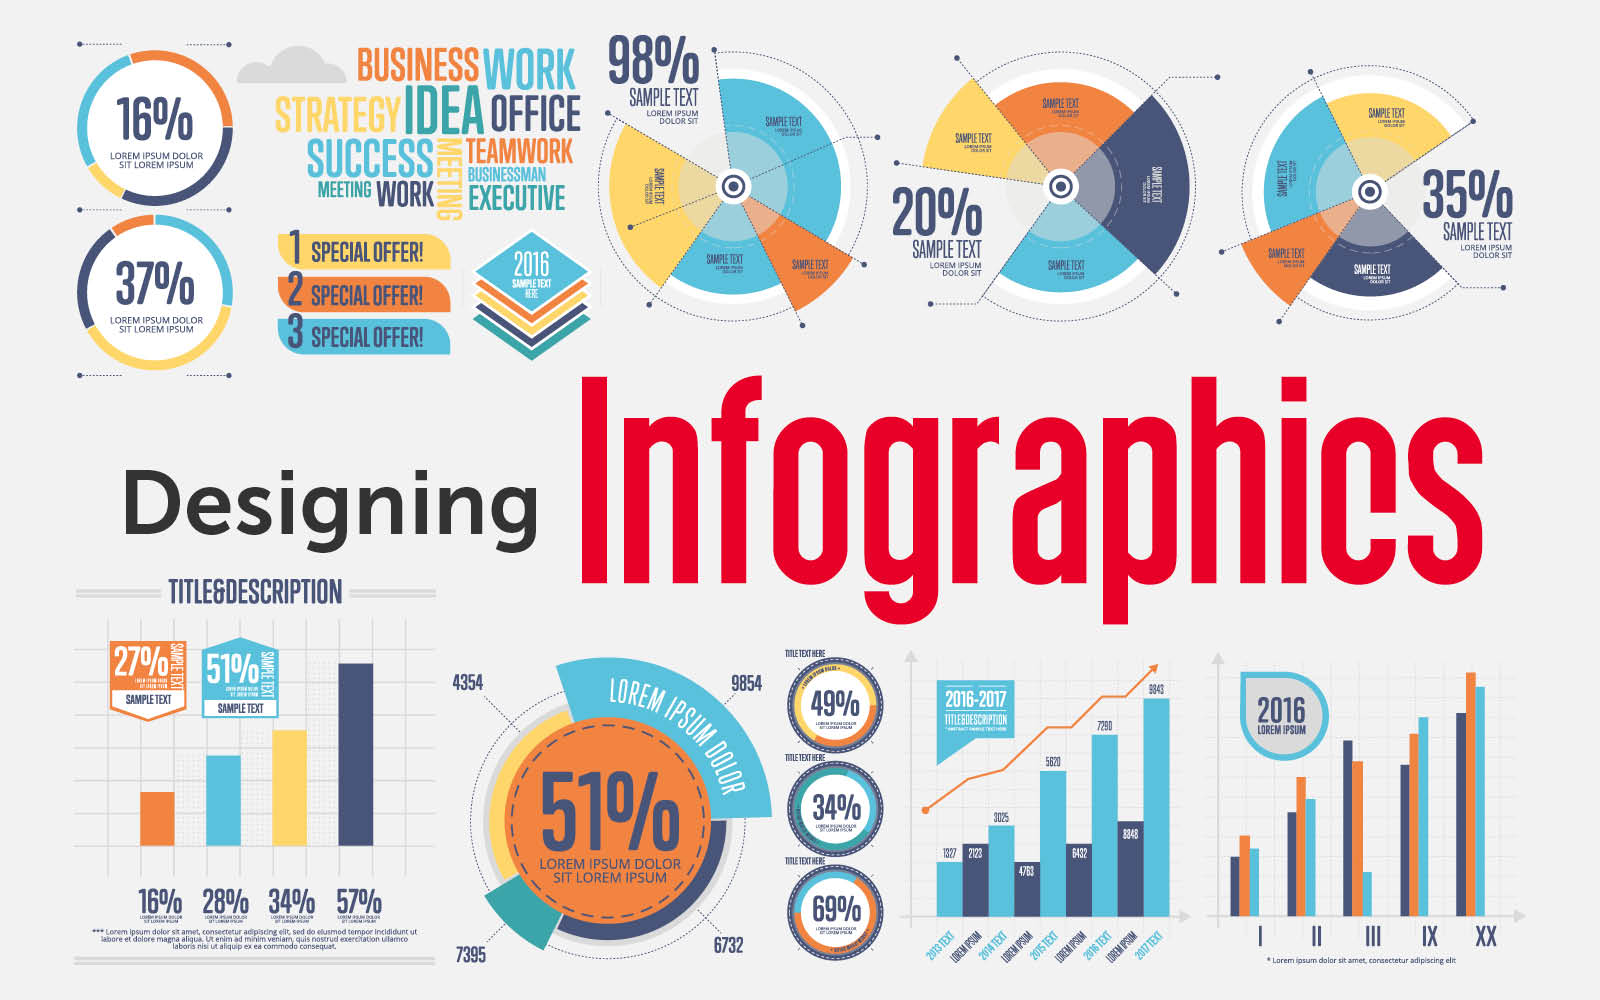
In our previous infographics blog, we discussed the advantages and disadvantages of using infographics in content marketing. In part two we provide our ten top tips to help you design successful infographics.
1. Know your target audience
Idea is only half the battle when it comes to creating a killer infographic. If you don’t know your target audience, your infographic is likely to be more ordinary than extraordinary. And that’s the last thing you want. The infographics with the most footing, most consideration, and most vitality are ones that meet your intended interest group right where they need it most.
Don’t make the mistake of creating an infographic that is generically attractive, rather than uniquely relevant to your target audience. The infographic has an intended appeal to your audience, so keep it precise, relevant, and targeted.
2. Keep it simple
One of the key advantages of infographics is that they can distill advanced ideas into a simple visual form. But at the same time, the inherent power of infographics can also be their demise. An infographic can become needlessly complicated, creating a mind-numbing cognitive overload rather than an “Oh, I get it” experience. Like everything else in life, infographics are better when they are simple. This infographic would work better as four or five infographics. Simplicity wins every time.
3. Keep it focused
Do not make your infographic a blend of statistical data points. Instead, make it streamlined and concentrated on separate topics. Infographics are not endeavors to randomly amass every single bit of information you can gather. Rather, an infographic should be used to drive a single, centered point.
4. Show things visually
Infographics should be short on the “realistic” and long on the “data.” The best infographics are ones that have a precise sense of balance of visual information with written information. This infographic uses a few icons and an image, but not a whole lot of other visual elements. To qualify for the graphic in infographic, it needs more visual elements.
5. Promote it
Infographics do not automatically go viral. You have to put in the time and effort to promote it. Even the most brilliant infographics don’t become popular over night. So yes, your infographic will require a lot of promotion. This can be done in the same way that you’d develop any other valuable piece of content.
6. Make it easy to view
Now and then, an infographic becomes mixed up in its resizing. The designer makes it colossal; at that point, the developer needs to cut it down. All the while, the clarity gets lost. Many infographics have an assortment of text dimensions. Ensure that the smallest text size on your infographic can be seen without much trouble. An infographic should be easy to read and view; 600 pixels wide is a good width to aim for.
7. Make it a convenient length and size
Infographics are supposed to be big. We get that. But go too big, and you’ll start losing people. A limit length of 8,000 pixels is recommended. Alongside a length, file size of an infographic must also be considered. Many users are on a moderate connection, so always try to keep your infographic to approximately 1.5 MB.
8. Add white space
An infographic is an exercise in graphic design best practice. Which means it is important to add white space around each individual graphic, to give it some breathing space. Your reader will thank you.
9. Create a killer headline
Your infographic’s headline is hugely significant. This rule is the same as with any blog article. The infographic does not get any consideration if it does not have a good headline. So what makes a good headline? Good headlines will have these features:
- they describe the infographic.
- they capture the user’s attention.
- they are short enough to understand at a glance; 70 characters is a good length.
10. Check your facts and figures
Infographics concentrate on displaying information. It’s a quick thought. Our brains can process details and rates way better when we see them, ensure that you’re precise by concentrating on these three often overlooked points.
- Make sure the information is real.
- Make sure that your sources are dependable.
- Make sure that your graphical illustration of the data lines up with the number (if you have both).
Conclusion
The wide-spread use of infographics is a relatively recent phenomenon. But the use of infographics to convey information is extremely popular. Infographics can offer you an unprecedented amount of ways for your business to stay ahead of the competition.
In terms of content marketing for your business, it’s worth looking into infographics. Especially if you have a blog or social media channels, because an attractive infographic makes for highly shareable content. But infographics might not be the most cost-effective type of content for your business. So make sure you understand the pitfalls before shelling out hundreds of dollars with high expectations.
If you would like to know more about infographics and how they could benefit your business, please do not hesitate to get in touch.
